
Investing in companies with a sustainable competitive advantage requires a thorough analysis of key financial metrics. The ‘Big Five’ metrics are crucial indicators that help investors identify companies with a strong moat, reflecting their ability to outperform competitors consistently. Let’s delve deeper into each of these metrics:
Return on Investment Capital (ROIC)
ROIC measures a company’s efficiency in using its capital to generate profits. It is calculated by dividing the company’s net operating profit after taxes by its invested capital. A high ROIC indicates that the company is using its capital effectively to generate returns, a sign of strong management and a competitive advantage. Consistently high ROIC over time suggests that the company has a moat that protects its profits from competitors.
Formula:
ROIC = Net Operating Profit After Taxes (NOPAT) / Invested Capital.
Interpretation: This metric measures how efficiently a company utilizes its capital – both debt and equity – to generate profits. A higher ROIC suggests that the company is creating more value from its available resources
Example: Reliance Industries Limited (RIL), known for its diverse business interests, has consistently demonstrated high ROIC, indicating efficient use of capital in profitable ventures like Jio and its retail segment.
- Bajaj Finance: ROIC (5-year average) = 28.4%
- HDFC Bank: ROIC (5-year average) = 22.5%
These companies consistently generate high ROICs, indicating their ability to efficiently utilize capital and generate significant returns.
Sales Growth Rate
The sales growth rate is a measure of how a company’s revenue has increased over a specific period. It reflects the company’s ability to grow its business, either by acquiring new customers, increasing sales to existing customers, or expanding into new markets. A steady increase in sales growth is often indicative of a strong brand, effective marketing strategies, or a dominant market position.
Formula:
Sales Growth Rate = [(Current Period Sales – Previous Period Sales) / Previous Period Sales] * 100.
Interpretation: This metric indicates the company’s ability to expand its revenue over time. A sustained positive sales growth rate suggests that the company is capturing market share and expanding its reach.
Example: Tata Consultancy Services (TCS), a leading IT services company, has shown impressive sales growth over the years, reflecting its expanding market presence and service portfolio.
- Asian Paints: Sales Growth Rate (5-year average) = 12.5%
- Reliance Industries: Sales Growth Rate (5-year average) = 7.8%
These companies demonstrate consistent sales growth, highlighting their ability to adapt and thrive in their respective markets.
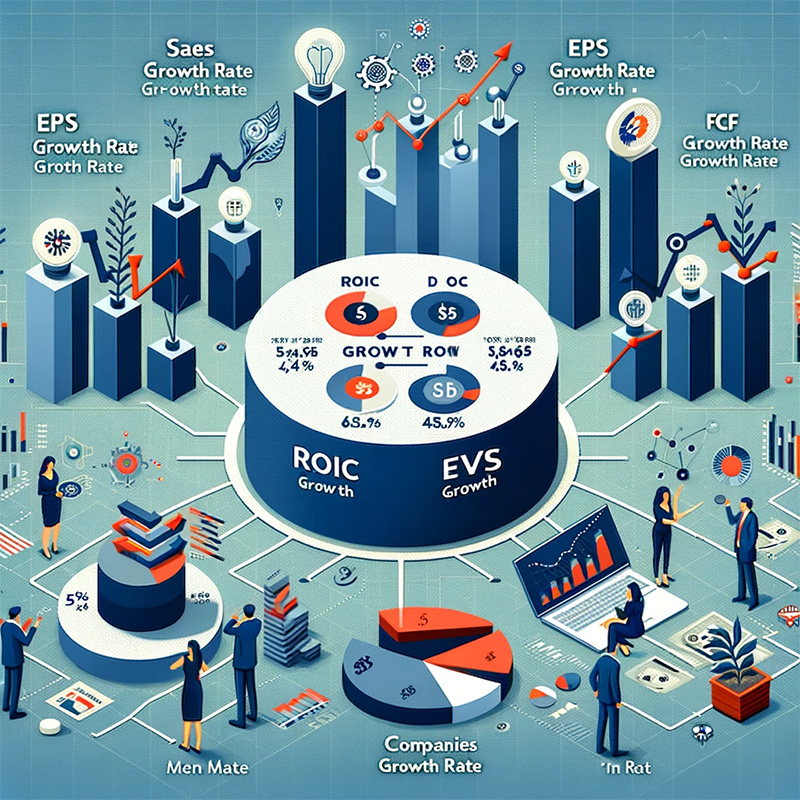
Earnings per Share (EPS) Growth Rate
EPS growth rate is a measure of a company’s profitability, showing how much earnings it generates for each share of stock. An increasing EPS growth rate suggests that the company is growing its profits, which can be due to expanding operations, improving efficiencies, or increasing demand for its products or services. Companies that consistently grow their EPS are likely to have a competitive advantage that enables them to generate higher profits.
Formula:
EPS Growth Rate = [(Current Period EPS – Previous Period EPS) / Previous Period EPS] * 100.
Interpretation: This metric reflects the company’s growth in profitability on a per-share basis. A rising EPS signifies increasing profitability, which ultimately benefits shareholders.
Example: HDFC Bank has shown a consistent increase in EPS, underlining its profitability and robust financial performance in the banking sector.
- Infosys: EPS Growth Rate (5-year average) = 14.3%
- TCS: EPS Growth Rate (5-year average) = 12.6%
These IT giants consistently deliver impressive EPS growth, demonstrating their ability to translate revenue growth into increased profitability.
Equity, or Book Value per Share (BVPS), Growth Rate
This metric represents the growth rate of a company’s net asset value or equity over time. A growing BVPS indicates that the company is increasing its assets faster than its liabilities, a sign of financial health and effective management. This metric is particularly important for investors looking for companies that are building value over the long term.
Formula:
BVPS Growth Rate = [(Current Period BVPS – Previous Period BVPS) / Previous Period BVPS] * 100.
Interpretation: This metric shows the increase in the company’s net asset value per share over time. A steady BVPS growth indicates that the company is accumulating wealth and creating value for its shareholders.
Example: Asian Paints has seen a consistent rise in its BVPS, indicating an increase in net asset value and reflecting the company’s growth and value creation.
- ITC: BVPS Growth Rate (5-year average) = 15.4%
- HUL: BVPS Growth Rate (5-year average) = 12.1%
These companies consistently expand their net asset value, showcasing their long-term wealth creation potential.
Free Cash Flow (FCF) Growth Rate
FCF growth rate measures how much cash a company generates after accounting for capital expenditures. It is an important indicator of a company’s financial flexibility, showing its ability to invest in growth, pay dividends, or reduce debt. A consistently high FCF growth rate is a sign of a strong business model that generates more cash than it consumes, often a characteristic of companies with a solid moat.
Formula:
FCF Growth Rate = [(Current Period FCF – Previous Period FCF) / Previous Period FCF] * 100.
Interpretation: This metric highlights the company’s ability to generate cash after meeting all its operational and capital expenditures. A positive FCF growth rate suggests that the company is generating excess cash, which can be used for dividends, reinvestment, or debt repayment.
Example: Infosys, with its steady FCF growth, demonstrates its ability to generate surplus cash, which can be used for expansion, dividends, or debt reduction.
- Maruti Suzuki: FCF Growth Rate (5-year average) = 23.4%
- Nestle India: FCF Growth Rate (5-year average) = 17.6%
These companies consistently generate significant free cash flow, indicating their financial strength and ability to fund future growth initiatives.
The Rule of Thumb for Sustainable Performance
A crucial benchmark for these metrics is that they should each show a growth rate of at least 10% per year over the last decade (10 years). This level of sustained performance is a strong indicator of a company’s durable competitive advantage or moat. Companies that meet this criterion are likely to have a robust business model, capable of delivering superior returns over the long term.
The Big Five as a Guide to Investment Decisions
The Big Five metrics provide a valuable framework for identifying companies with strong moats. By analysing these metrics over time and comparing them to industry peers, investors can gain valuable insights into a company’s competitive advantages, financial health, and long-term growth potential. Remember, successful investing requires a holistic approach that considers not only financial metrics but also qualitative factors like management quality, industry trends, and overall business strategy.
Next: Management as the X-Factor in Indian Investment.
Prof. Dr. Prahlada N. B
12 December 2023
Chitradurga.


[…] Next: How to identify companies with a Moat? […]
ReplyPrahlada Sir,
To summarise your blog on ' moat rating '….
Moat rating of any company, refers to its competitive advantages over other similar companies in the market.
So…..
ReplyBy knowing a company's moat rating, one can assess the long-term viability & profitability of that company, & invest wisely.